

Correlation measures the strength of the relationship between the two assets.
The correlation coefficient is a formula that assigns a value between -1 and 1 to assess the degree to which two securities move together. The correlation coefficient does not explain why securities are or are not related; the correlation coefficient only quantifies the relationship.
Two securities that have a correlation of 1 are said to have perfect correlation and theoretically move identically. A positive correlation means that as one security moves up or down, the other tends to do the same. For example, an increase in oil prices is likely to lead to an increase in gasoline prices.
A correlation of -1 indicates a perfect negative correlation and means that for every move one asset makes, the other asset moves in the reverse direction. A negative correlation occurs when the price of one asset rises while the other falls. For example, gold prices tend to fall as the U.S. dollar becomes stronger.

A correlation coefficient of 0 means there is no relationship between the two securities; they are uncorrelated. If two securities are uncorrelated, it is impossible to predict the direction of one based on the movements of the other. For example, changes in the weather do not affect stock prices.
Zero correlation is considered a strength of a balanced, diversified portfolio to ensure that all assets under management do not move in conjunction. Zero correlation suggests that while some stocks in a portfolio may decline in price, others will move independently.
Investors may combine negatively correlated assets to serve as a hedge. Positively correlated assets may be combined to express a directional bias.
Autocorrelation is the degree to which a security's price movements are associated with its past price movements. If prices move in the same direction as they have in the past, they are said to be autocorrelated. Positive autocorrelation means that a positive observation is likely to be followed by another positive observation. Negative autocorrelation means that a positive observation will be followed by a negative.
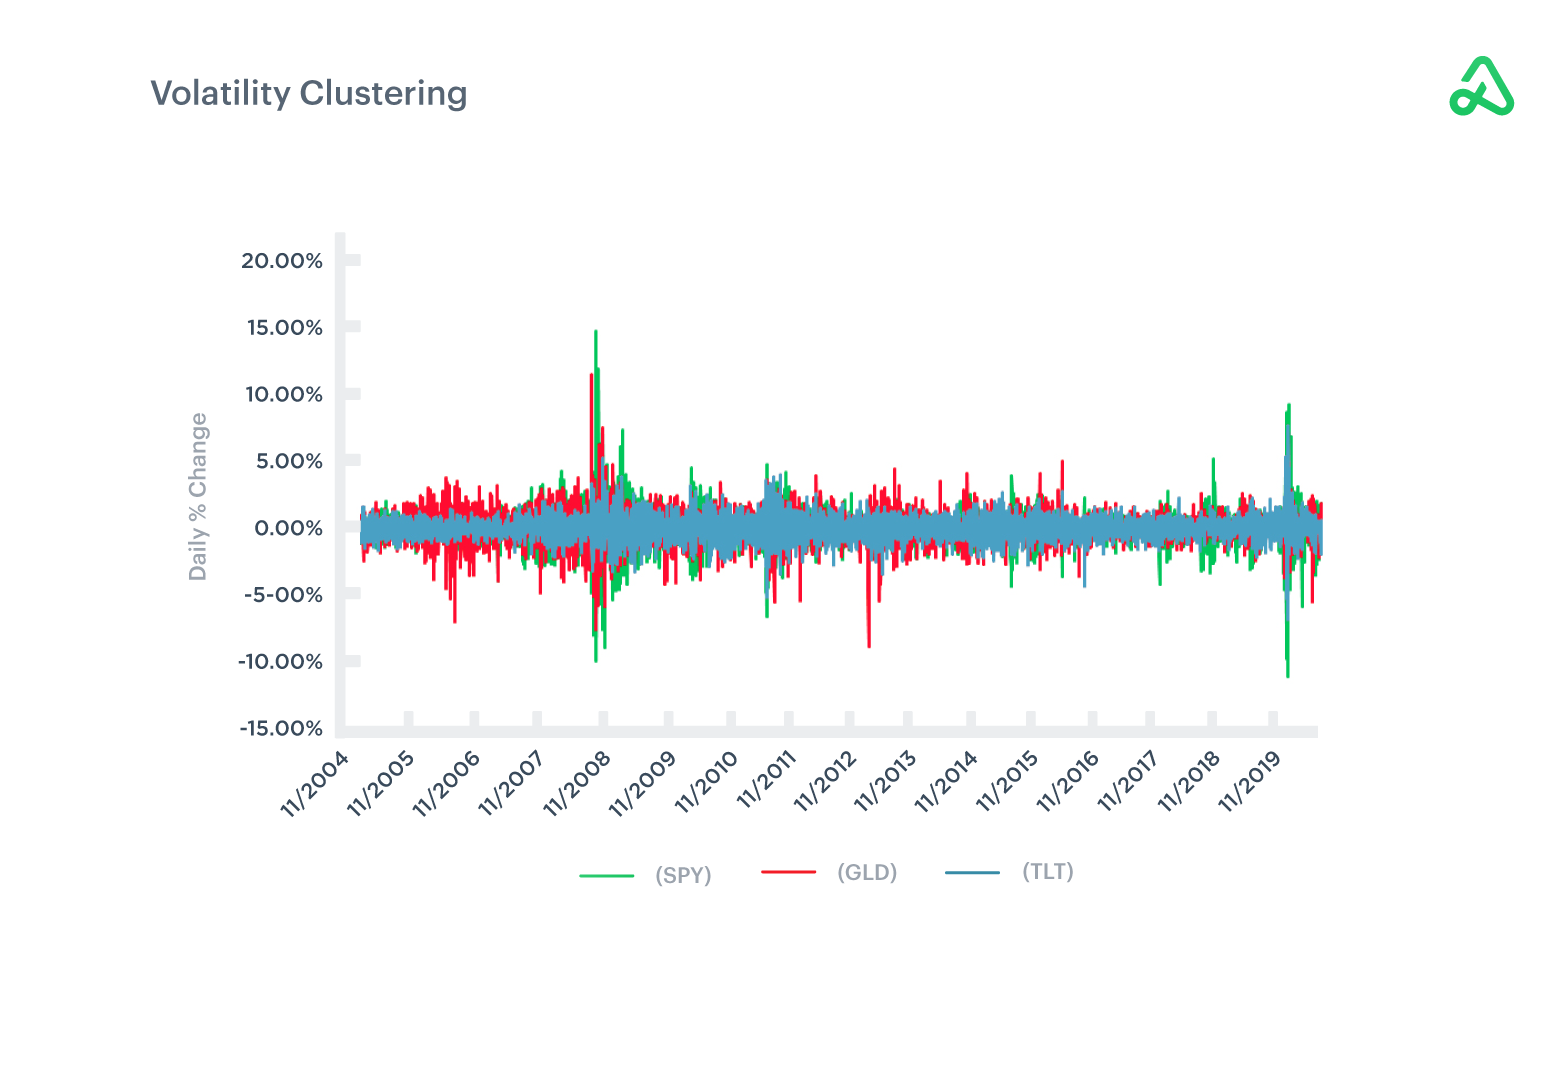
Research has shown that when volatility increases, assets with little or no previous correlation suddenly move in sync with one another, thus rendering diversification less effective when markets crash. Correlation breakdowns are often sudden and can have a significant impact on portfolios. Relative correlation can change as time progresses and securities demonstrate different characteristics.

R-squared measures the amount that a portfolio’s performance can be explained by the movement of a benchmark, like an index.
R-squared is the squared correlation of the portfolio or fund to the market. R-squared is measured on a scale of 0-100 percent. R-squared helps interpret a portfolio’s performance.
The higher the R-squared, the better a portfolio can be explained by movements in the benchmark. For example, if a portfolio has an R-squared of 80%, that means 80% of the portfolio’s performance can be explained by the performance of the benchmark, and 20% of the portfolio’s return is driven by the specific portfolio holdings.
A value of 1 indicates that the portfolio will behave exactly like the index. Values above .70 are said to be high.